New reports Yandex Metrics![]()
Obviously, websites, like channels or communities on social networks, should have metrics similar to:
- number of followers (brand reach)
- influx (brand users)
- Churn (user lifetime)
Surprisingly, the global web analytics systems Google Analytics and Yandex Metrica do not provide metrics similar to social networks.
Brand metrics are the essence of the new reports of the Brandcounter service.
Brandcounter methodology - is focused exclusively on sites that have the characteristics of a financial asset and have their own monetization as their goal
Register on the Brandcounter website and you will have access to new reports for your site.
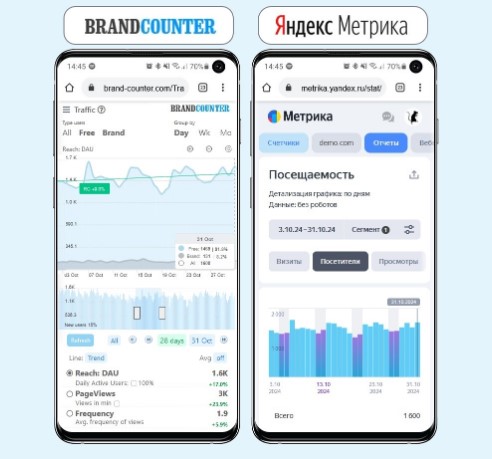
This is what the Visitors (DAU traffic) report looks like in the original version of Yandex.Metrica and Brandcounter
Reports are built using the API to your Yandex Metrika counter data.
New reports show the dynamics of your resource value change:
1. Traffic generated by your brand
2. Conversion of New users to brand
3. User retention
4. User cost, LTV
5. Cost of your site, DCF
Using a real site as an example (demo-site.com), without registration, you have access to the full functionality of Brandcounter reports. By changing the financial settings, see the corresponding changes in reports #5, #6 and Calculator
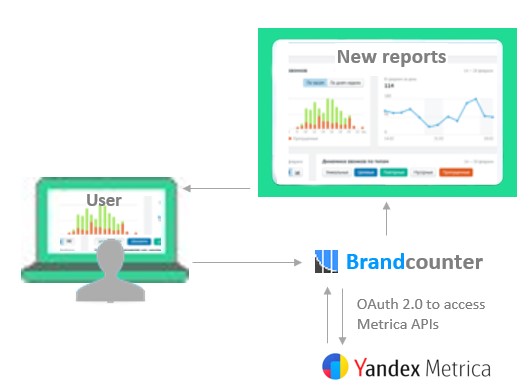
The OAuth 2.0 protocol allows the Brandcounter application to work with the Yandex.Metrica service, creating New reports for the user
#1 Traffic: Free and Brand users
Traffic segmented by user type:
- Free users — visit the site 1 day
- Brand users – visit the site > 1 day
Brand users — make up a regular audience, which is the main value of your site.
β = Brand/(Free+Brand)
The higher the share of branded users β in traffic, the more valuable your site is.
Segmentation into Free and Brand users clearly shows more valuable traffic ![]()
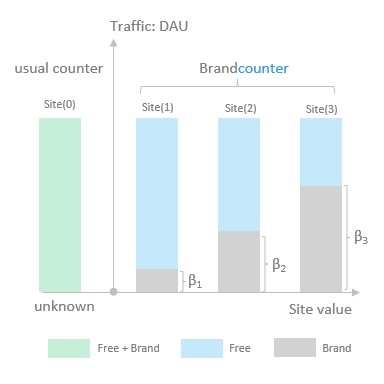
The larger the brand share β, the more valuable the site traffic is
#2 Conversion: of New Users to Brand
![]() metric: conversion rate, α — the most important indicator responsible for the share of New users who converted to Brand users (see fig)
metric: conversion rate, α — the most important indicator responsible for the share of New users who converted to Brand users (see fig)
α = Brand/New
Monitoring the indicator (α) helps to evaluate the quality of your brand promotion
There is no more valuable event than repeated day of site visit of user.
(don`t confuse  with  second session within day)
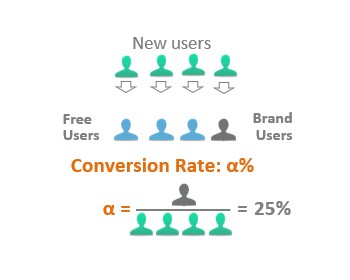
Conversion rate formula α
#3 Retention: α and ω web analytics
![]() α and ω are basic user retention metrics on your site.
α and ω are basic user retention metrics on your site.
Product [α x ω] — brand markup, responsible for the amount of premium (brand) traffic on site.
Daily traffic DAU (Daily Active Users):
DAU = New + Brand = New(1+αω)
Freg retention, ω — avg number of days of user visit during lifetime on the site
![]() Example. For your site: α=50% and ω=50, then the brand markup (αω)=25
Example. For your site: α=50% and ω=50, then the brand markup (αω)=25
— Let’s say 100 new users come to the site every day. Its daily traffic will be: DAU=100*(1+25)=2600 ![]()
— One purchased user will visit your resource 25 more times (days) during his lifetime and will bring you additional income of 25*ARPU (Avg Revenue Per User)![]()
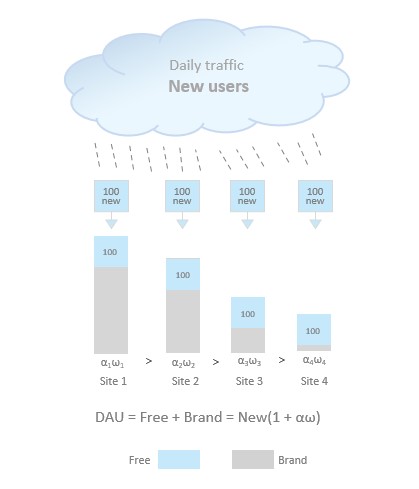
Impact of retention parameters α and ω on traffic. For all sites New users=100.
Calculator: DAU, Revenue, LTV, DCF
Successful promotion of your resource is the result of effective work:
- Acquisitions of new users
- Retention of new users
The calculator will help you choose between promotion strategies (see p.1 and p.2)
Let’s rewrite the DAU formula as follows:
DAU = New(1 + α T1/T2 )
where ω = T1/T2 is defined through the lifetime T1 and the visit period T2 of the user
Varying parameters T1 T2 α and New users in the Calculator and using Revenue settings you can see how the key indicators of your resource change.
One click in the menu and you have access to the full functionality of the Calculator without registration
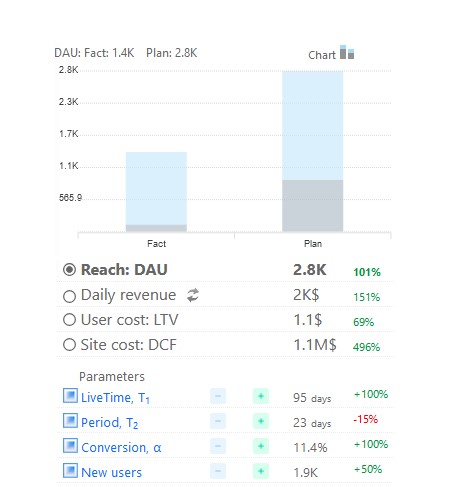
By varying the parameters achieved on your resource using the (+-) buttons, see how the key indicators change: DAU, Revenue, LTV and DCF
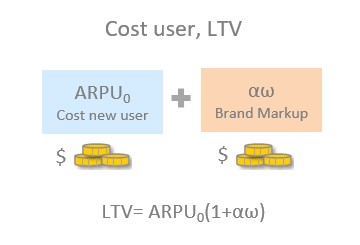
#5 Cost user: LTV
Lifetime Value: LTV — avg user revenue during their lifetime on the resource
LTV= ARPU0(1+αω)
- ARPU0 — avg revenue per New user
- αω — brand markup to ARPU0
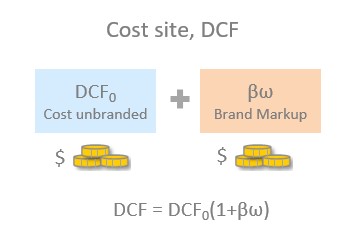
#6 Cost site: DCF
The cost is calculated the Discounted Cash Flow method (DCF):
DCF = DCF0(1+βω)
see perpetual annuity formulas
- DCF0 =Profit x n0 — value of a unbranded asset. Default payback period n0=1yr, see settings
- βω — brand markup to DCF0
Yuri Ryazanov, Dec. 2020