industrial valuation of your Internet asset
The discounted cash flow (DCF) method summarizes the future cash flows of your asset. Each cash flow is multiplied by a discount factor 1/(1+i)m. As a result, we get the present value of your asset.
DCF=P1/(1+i)1+ …+Pm/(1+i)m (1)
Pm – profit of m-period, i – discount rate
To calculate the cost estimate, we take:
P=P1=P2=…= Pm и m→∞
We summarize (1) using the geometric progression formula:
DCF=ΣP/(1+i)m→∞ = P/i (2)
For the accepted assumptions for P and m, formula (2) is strict. The profit value P is known. The main problem is to find the discount rate
Determining the discount rate i actually means knowing the planning horizon for the achieved profit. The owner of the asset can make a forecast for the future at an expert level (intuitively). The Brandcounter service cannot predict future income for a third-party resource without model-based reasoning.
The discount rate i and the payback period n are related i=1/n then from (2) we write:
Cost site: DCF=P/i =P·n (3)
Let us express the payback period from (3):
Payback period: n = DCF/P (4)
Expression (4) is the most famous stock exchange indicator — the P/E “price to earnings” multiplier, the ratio of the company’s market capitalization to annual profit. P/E is the payback period for an investment. Obviously, the reciprocal is the rate of return on investment ROI
Example: you bought shares for $100 with a P/E multiplier = 10, the estimated return on investment period is 10 years and, accordingly, the return on investment ROI = 1/10=10%
Key parameters of the asset value formula:
i — discount rate (ROI)
n — payback (P/E multiplier)
Industrial valuation of DCF requires a way to estimate payback or profitability.
The search engines Yandex and Google use behavioral factors as the main criteria for ranking sites. Search engines assess the quality of a site and its practical usefulness by analyzing user behavior.
Let’s do the same. We will estimate the payback period from user behavior on the site.
Typically, models for determining the discount rate are based on the risk-free rate (yield on government bonds) and then add premiums for risks: entering a new market, a new product, level of competition, etc. Risk premiums can reach 50%
Let’s do exactly the opposite. We will start from the most risky bet.
Let’s introduce the concept of a unbranded asset:
We will call a unbranded resource that is visited by users for only 1 day (the number of sessions is not important)
Risk premiums for investing in a unbranded asset should be maximized. The lack of repeated days visits indicates to us that this resource is not interesting to users for various reasons…
Expert assessment from the author:
For a unbranded asset, the payback should be in the range of n0 =[0.5 до 1.5 лет]
Let us formulate mnemonic rules for assessing the risks of investing in a unbranded asset:
- n0 = 0.5yr [i0=200%]– high risk premium for the investor, but unprofitable for the seller
- n0 = 1.0yr [i0=100%]– avg risk premium for investor and fair price for seller
- n0 = 1.5yr [i0=66%]– low risk premium for the investor, benefit for the seller
In the Bradcounter service, by default n0 =1yr.
From (3) the value of the unbranded asset:
unbrand cost: DCF0=P/i0 =P·n0 (5)
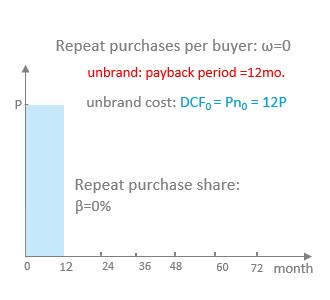
Let the payback be equal to n0=12mo. Then the value of the unbranded asset is:
DCF0=P·n0=12P (6)
the cost is equal to 12mo. profit (1 annual profit), see fig. DCF0 is the area of the column
Let’s consider the extreme case when 100% of revenue is repeat purchases, so all buyers visit the resource > 1 day.
Branded buyers - if the number of days of visit ω>1
Obviously, for the extreme case when the resource is 100% branded, you can write:
DCF=P·n0(1+ω)=12P(1+ω) (7)
Formula (7) goes into (6) if ω=0, there are no branded buyers. It is important to note that for the two extreme cases (6) and (7) the investment is equally attractive. The risk premium is determined by n0 in (6) and (7) — the values are equa
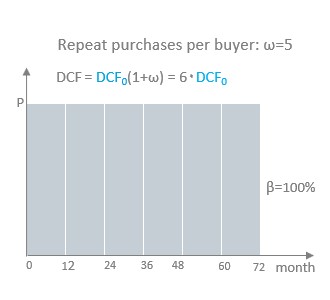
Let us introduce the indicator β — the share of revenue from branded buyers. Then it is not difficult to write down the general formula for the value of an asset:
DCF=Pn0(1+βω) =DCF0(1+βω) (8)
P – profit
no – payback period of a unbranded asset
DCF0=Pn0 – cost of a unbranded asset
β – share of revenue of branded buyers
ω – avg number of days visit
(1+βω) – brand multiplier
βω – brand markup
For example, let β=40% and ω=5 then DCF=DCF0(1+0.4·5)=3·DCF0 (see figure)
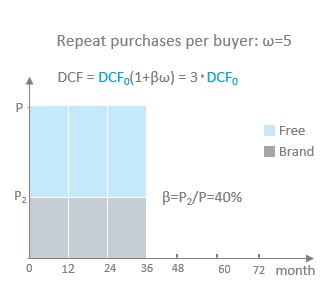
Comparing formulas (3) and (8) we can write:
- Payback period: n=n0(1+βω)
- Discount rate: i= i0/(1+βω)
Note: For calculations, you should limit the upper limit of payback and the lower limit of the discount rate to the risk-free rate of the alternative investment.
The Brancounter service defaults to:
nmax=n0(1+βω) < 10 yr
imin= i0/(1+βω) >1/10=10%
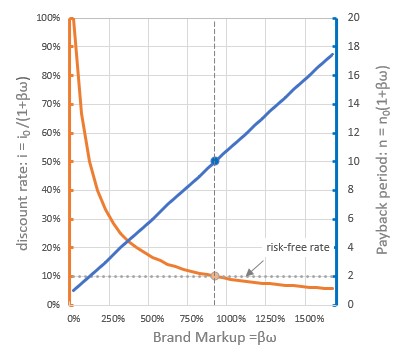
unbrand discount rate: i0=100%
unbrand payback period: n0=1
risk-free rate =10%
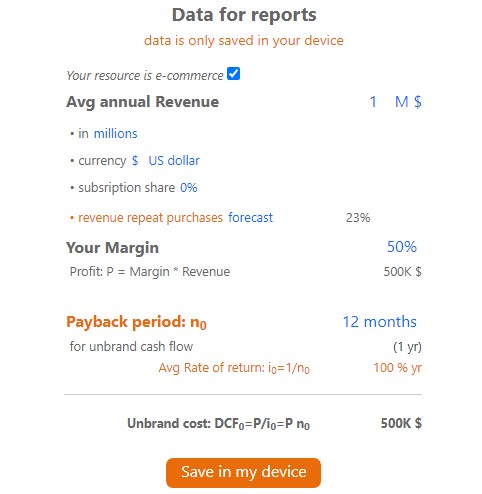
To estimate the cost of your resource in the Brandcounter service, you need to fill out the form, see fig.
If you wish, the data is stored in your browser and is not transferred to the service. 100% confidentiality of information is achieved.
Not every store owner knows his β indicator. The Brancounter service analyzes user behavior and calculates the predicted value of the share of revenue from repeat purchases (in the figure this value is 23%). However, if you do not agree with the service’s forecast, you can edit the value.
Also, based on your data on annual revenue, an LTV (lifetime value) report is built — the income of the average user that he brings for the entire time he visits your resource, also see Brandcounter method
In conclusion, we give an example of using formula (8)
Let’s calculate investment indicators for two online stores with the same monthly revenue but different shares of regular customers. The sources of customer traffic to stores are approximately the same: organic search and advertising campaigns
Example 1: watch store, profit $5000 per month, n0=12 months (see figure)
Traffic analysis shows the absence of branded users β=0% and this is due to the negative experience of making the first purchase of a product. Underestimating the logistics of delivering goods to the buyer can have a catastrophic effect on the measured indicator ω. In Brandcounter reports, this indicator is called (Freq retention). Equality ω=0 means no repeat visit days. The cost of such a resource is the lowest possible — DCF0 and, accordingly, the brand markup is zero. According to formula (8):
DCF=DCF0= 5 000·12мес =60 000$
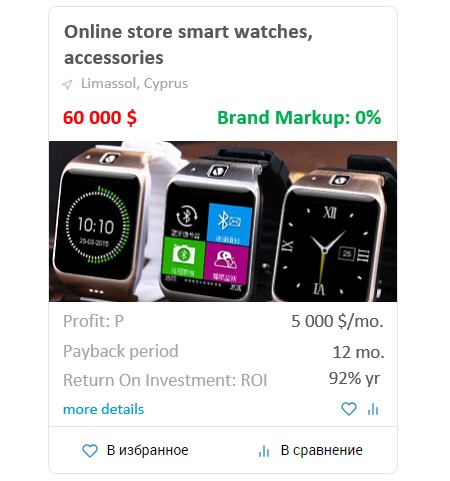
unbrand: payback period: n0 =12 mo.
unbrand cost: DCF0 = Pn0 = 60 000$
repeat purchase share: β=0%
rereat purchases per buyer: ω=0
brand Markup: BM=βω=0%
DCF=DCF0(1+BM)=60 000 $
Example 2: electronics store, profit $5000 per month, n0=12mo. (see figure)
Share of revenue from repeat purchases β=40%. A delusional buyer makes purchases ω=5 times. Thus, a regular user visits the store on average 5 times (days) over the entire lifetime of using the store. The number of sessions does not matter. Cost according to formula (8):
DCF=5000$·12мес·(1+0.4*5)=180 000$
A brand markup of 200% is responsible for a 3-fold increase in cost.
It is important to emphasize that the risks in both examples reach the calculated payback indicators of 12 mo. and 36 mo. - are the same. Since the parameters n0=12 months are equal.
It is surprising that despite the huge difference in estimates of the value of stores, the investment attractiveness of both cases is comparable and the question of choosing an investment subject only depends on the financial capabilities of the investor
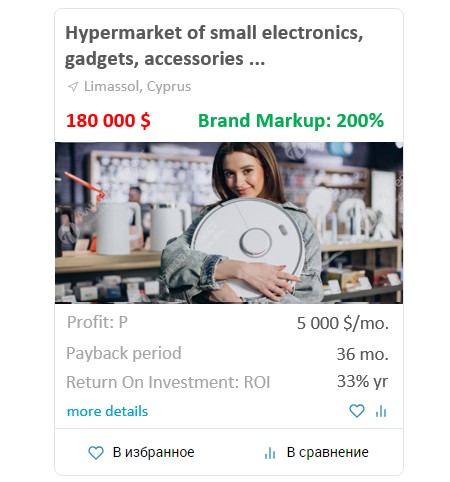
unbrand: payback period: n0 =12 mo.
unbrand cost: DCF0 = Pn0 = 60 000$
repeat purchase share: β=40%
repeat purchases per buyer: ω=5
brand Markup: BM=βω=200%
DCF=DCF0(1+BM)=180 000 $
Summary
Let’s rewrite expression (1) again, after summing up the future cash income of your asset, we get a strict formula:
Discounted Cash Flow: DCF= P/i (2)
To calculate the discount rate i, the following model is proposed:
The only parameter of the model i0 is the discount rate for the unbranded asset. A unbrand asset is the absence of repeat purchases, ω=0.
Let’s consider the limiting case when all purchases are repeated ω>0. Let the average buyer make repeat purchases ω times. Obviously, the income of such an asset will be (1+ω) times greater than the income of a unbranded asset with the same number of buyers. In the general case, when the share of income from repeat purchases is equal to β, we write the formula for calculating the rate:
i= i0/(1+βω)
indicators β and ω – can be measured by web analytics systems:
β – share of regular (brand) users
ω – avg number of days of visits during the user’s lifetime.
Formula (2) can be rewritten as follows:
DCF=P/i0·(1+βω)=DCF0(1+βω) (8)
DCF0=P/i0 — the cost of a unbranded asset
βω — brand markup
It is much easier to agree on the value of the non-brand rate i0 when the rate is used for industrial assessment of the cost of resources.
By default, the Brancounter service uses the rate i0=100% per yr. (payback period no=1yr.)
Yuri Ryazanov
Mar. 2023

