on the example of the store of the 1st product
Daily website traffic according to the formula
All = New(1+αω) (1)
- Conversion to brand, α — share of new users who visited the resource > 1 day
- Freq retention, ω – avg number of days of brand user visits during their life on the resource
Physical meaning (1+α ω) - avg number of days of user visits during lifetime
For each site, brand indicators α and ω are unique and change little over time. You can increase the «New users» traffic many times, but this will not affect the brand indicators (α ω)

Alpha and Omega are independent indicators of brand quality
Brand markup: BM = α ω can be used as an indicator of the effectiveness of your brand promotion, similar to the Google Brand Lift service.
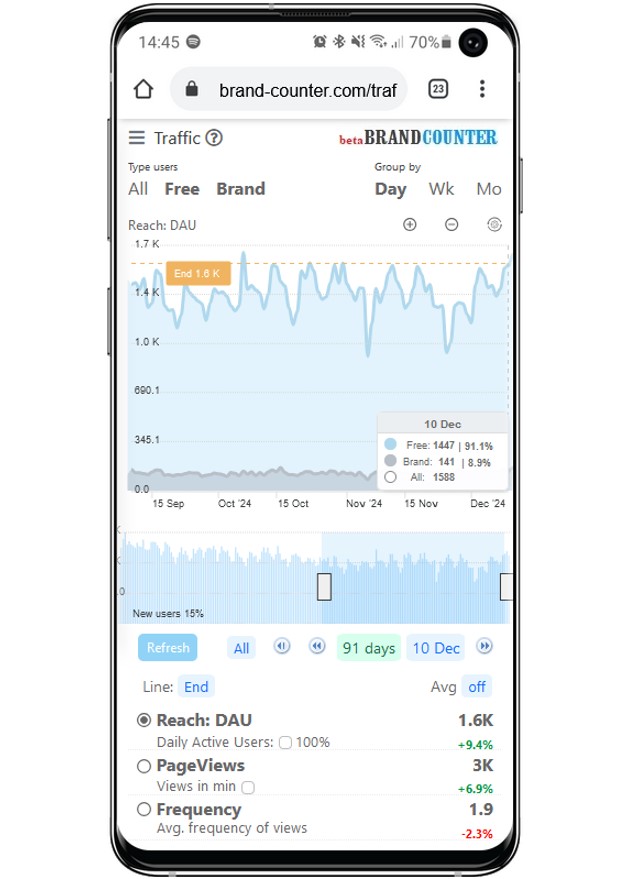
#1 Traffic: DAU=Free+Brand=New(1+α ω)
Example: Store #1
a) Only 1 product for sale
b) Users = customers
We know that:
- 100 new customers make 1 purchase daily
- 10% of new customers visit the store >1days
- Avg consumption time of the product T1=300 days
- Avg purchase period T2= 30 days
- Avg visit days per 1 customers ω= T1/T2=10
- Price of 1 unit: A = 1$
- Sales margin: M = 50%
Thus, the brand margin: αω=10%*10=100%. Sales traffic according (1):
DAU = 100(1+100%) = 200
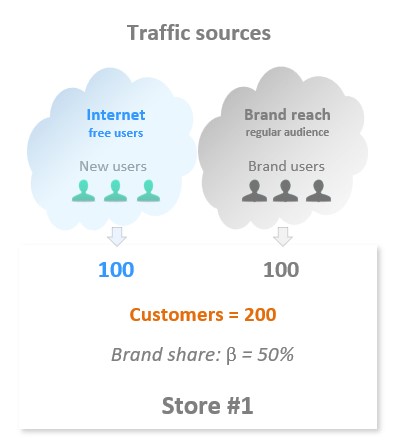
In the store for 1 day out of 200 customers — 100 branded (share β=50%)
One of the sources of traffic (see fig.) is the regular audience accumulated by the brand (Brand reach).
Brand reach (regular audience) is the brand's accumulated customers who will visit the store >1 day
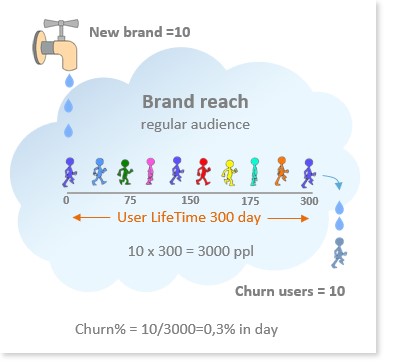
According to the conditions of the task, the conversion of New users to Brand is α= 10%, then New brand = 10% * 100 = 10 per day, thus every day 10 New branded customers make a second purchase (1 purchase was made by the customers in the New status). Cumulative Brand Reach (See Figure):
Brand reach=New brand x T1=3000
General conclusions on store traffic:
10% of 100 New buyers are converted into a permanent audience of buyers. If there is an equilibrium between the influx of New brand customers and their outflow after 300 days (see figure), the value of the brand’s regular audience is 3000 ppl. Every day, out of 3,000 ppl, 100 visit the store. Thus, out of 200 customers, branded accounts for 50%
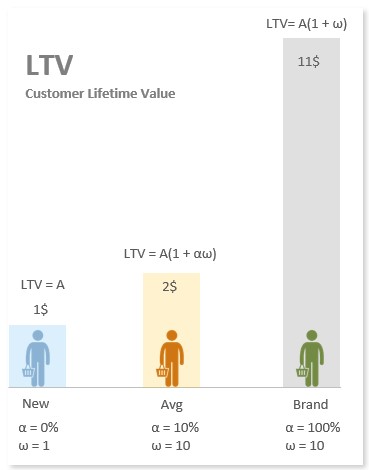
LTV (Lifetime Value): Customers cost
Price 1 unit product: A =1$ then:
- for a new customers LTV =1$
- for branded LTV = 1$ x (ω+1) = 11$
(+1 takes into account that 1 purchase is made in the status of a new customer)
Avg customer cost formula (see pic):
LTV = A(1+αω)___(2)
- “A” values are calculated by Brandcounter service based on annual revenue data, see settings
Substituting the values in (2) we get:
LTV= 1$(1+10% x10) = 2$
Obviously, formula (2) is also valid for the limiting cases:
a) for new customers α =0 and LTV = 1$ ,
b) for branded α=100% and LTV = $11
Conclusion: the average income per 1 customer is 2$, considering the margin of 50%, the avg profit per 1 customer is 1$. These values should be taken into account when conducting promotions
DCF (Discounted Cash Flow): Store#1 cost
Let’s introduce a parameter, n0 — payback period, let n0=0.5 years for a ubranded product.
A unbranded product means that the choice of its customers is random (situational) in nature and market actions can greatly affect the stability of cash flow over time.
Thus, the parameter, n0 — sets the lower limit of the payback period of investments. The cost of unbranded cash flow:
DCF0= Profit x n0___(3a)
- Profit and n0 is set in the settings
the investor assesses the risk of buying a unbranded asset as acceptable if the price is equal n0 =0.5 annual profit
Let’s consider another limiting case. All buyers make repeat purchases. Then the payback period of 100% branded product nB=n0(1+ω). Cost of 100% branded cash flow:
DCFb= DCF0(1+ω) (3b)
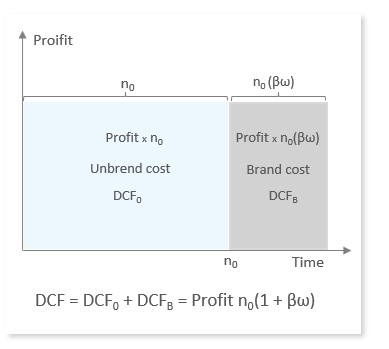
the investor assesses the risk of buying 100% of the branded asset as acceptable, at a price equal nB=0.5x(1+10)=5.5 annual profit
It is important to note that despite the 5,5/0,5=11-fold difference in price, the investment risks for the 2 extreme cases are equal.
Cash Flow Value Formula:
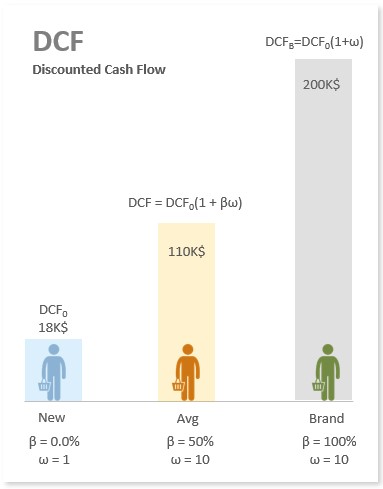
DCF = DCF0(1+βω) (4)
- for a non-branded asset β=0 and DCF = DCF0
- for β=100% branded asset DCF=DCF0(1+ω)
the investor assesses the risk of buying β=50% of the branded asset as acceptable for a price equal n=0.5(1+50% x10)=3.0 annual profits
According to the initial conditions:
Annual Profit = Margin x [Revenue] =
=50%[1$ x 200 ![]() х 365days]=$36.5K
х 365days]=$36.5K
Unbrand cost Store#1 according (3a):
DCF0 =36.5K$ х 0.5yr = 18.3K$
On formula (4) we find the cost of Store#1:
DCF =18.3K$(1+50% x10) =110K$
- Payback period n=n0(1+βω)=0.5x(1+50%10)=3.0yr
- Return on investment % in yr ROI=Profit/DCF=1/n=1/3=33%
It was so easy to show the Brandcounter methodology in numbers thanks to the strong simplification of “users=customers”.
Of course, in reality, only a small part of users become customers. And the average check of New users and Brand users can differ significantly. Yes, this greatly complicates the general formalism and nothing more.
Yuri Ryazanov
Jan. 2022

