The presence of a regular audience is the most valuable asset of your resource
None of the existing web analytics systems answers the question:
- Why, with comparable values of New users for competitive resources, their traffic can differ significantly?
Brandcounter using web analytics API Yandex metrics shows user retention parameters
Returning users within the same day cannot be considered retention users
Brand users visit the resource >1 day
 Rhetorical question: which user is more valuable:
  5 sessions in 1 day - Returning user?
  5 sessions: 1 per day - Brand user?
We segment traffic by user type:
- Free users — visit the resource 1 day
(free from the brand) - Brand users — visit the resource >1 day
(loyal to the brand)
Note: from the definition of Free users it follows that for daily traffic:
New Users = Free Users (1)
for the period of traffic grouping 7 days, 30 days, etc. the equality is not true, since part of the New users is converted to Brand

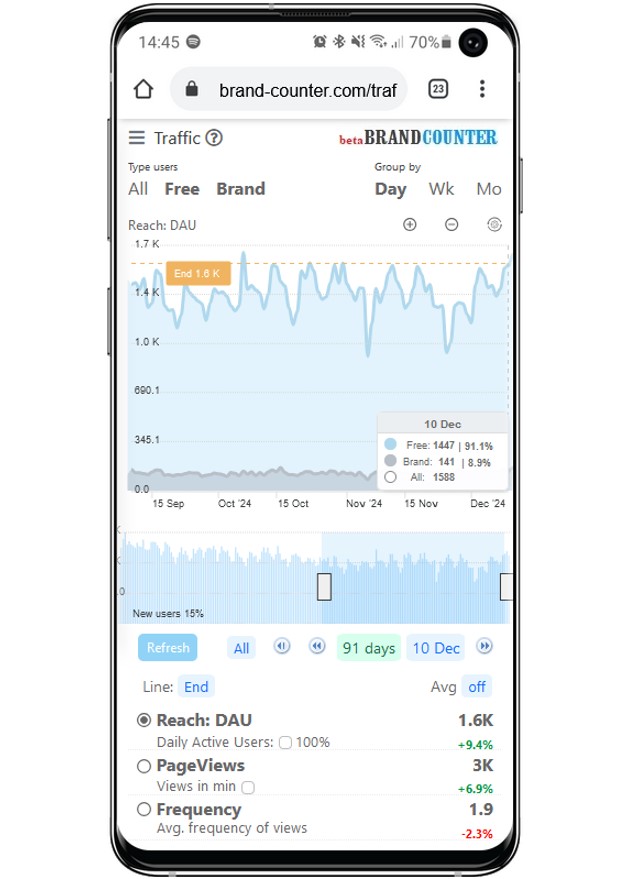
#1 Traffic: DAU=Free+Brand=New(1+α ω)
Let’s write down the formula for daily traffic DAU (Daily Active Users) taking into account equality (1):
All = Free + Brand = Free (1 + α ω) (2)
- (1+α ω) — brand multiplicator
- α ω — brand markup
Physical meaning (1+α ω) - the avg number of days of visit by user during their lifetime:
— for α=0%, visit the resource 1 day
— for α=100%, visit the resource (1+ω) days
User retention metrics ![]() :
:
α(f+), % — share (reach) of retention of users who visited the resource f days or more: 2+, 3+….
α, % — the conversion rate of user to Brand is a special case of the spectrum α(2+)
ω = T1/T2 — freq retention: avg number of days of visit during the user’s lifetime on the resource. T1 – User Lifetime, T2 – Visit Period
Alpha and Омеgа — web metrics of your resource that determine brand traffic

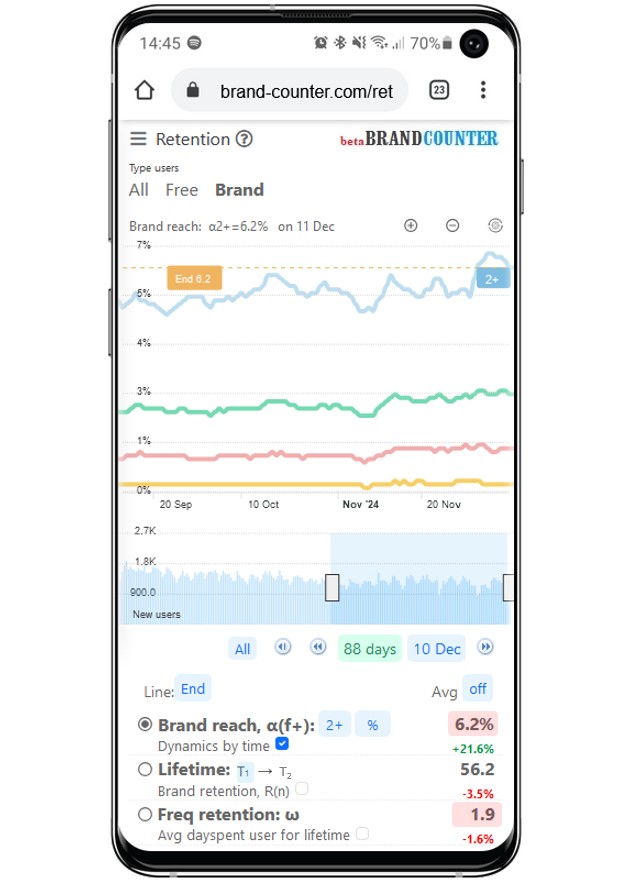
Brand markup=(α х ω)=(6.2%*1.9)=12%
See photo Report #1: DAU=1.4К(1+12%)=1.6К
The Retention report contains all the significant indicators of the permanent audience of your site:
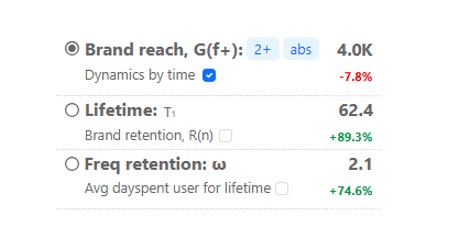
1. Brand reach, G(f+) – distribution of users (abs and %) by the number of visit days
2. T1 ; T2 — user lifetime and visit period in days
3. Freq retention, ω — the avg number of days of visiting the resource
Regular audience is quantitatively equal to Brand reach:
Brand reach, G(2+) - is the number of users accumulated by a brand who will return to the resource 2 or more times.

Let us write formula (2) in the form:
DAU = New(1 + α T1/T2 ) (3)
DAU contains 4 independent parameters:
- Lifetime, T1
- Visit Period, T2
- Conversion to brand, α
- New users, New
To study the impact of T1 T2 α и New parameters on the key indicators of your resource:
- Reach: DAU
- Revenue
- Cost user LTV
- Cost site DCF
An interactive «Calculator» has been created
Example of working with a calculator
Let’s increase the parameters T1 and α by 100%:
ω=(T1+100%)/T2→ 2ω and (α+100%)→ 2α
The brand markup will increase by 4 times (+300%):
Brand markup: (α х ω) → 4(α х ω)
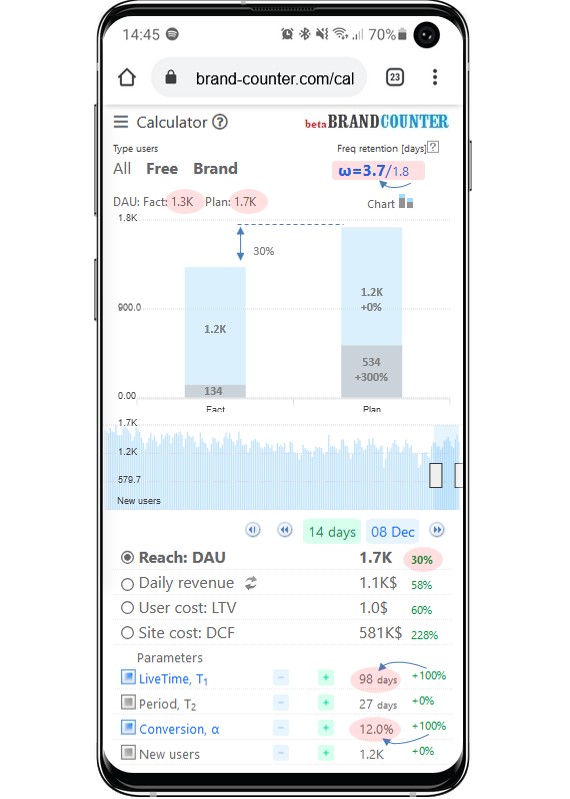
See photo Calculator: substitute the values of Fact and Plan in formula (3):
Fact: DAU=1.2K (1+6%*49/27)=1.3K
Plan: DAU=1.2K (1+12%*98/27)=1.7K
see calculation formulas: DAU, LTV и DCF
Changing α and ω в by 2 times resulted in:
1. DAU +30% (1.3K→1.7K)
2. Revenue +58%
3. Cost user LTV +60%
4. Cost site DCF +228%
The large increase % in points 2-4 is due to the significantly greater contribution of Brand than Free users to the financial indicators on the test site

Right column, Plan — pressing (+ -) ↑ by 2 times T1+100% (с 49 до 98 days) и α+100% (с 6% до 12%)
It is important to note that the New users value in the example remained unchanged (1.2 K).
You can increase New users through organic or purchased traffic, and this will not affect the achieved retention parameters in any way ![]()
The data for the calculator is exported from the database and averaged over the period you select on the reporting date, using the joystick or manually using the sliders on the Brash chart
Often there is no alternative to purchased traffic. Because the risks of buying traffic are minimal. But the risks of ruining the resource with «good» initiatives are huge.
Measure twice, cut once — before changing anything on the site, in the hope of improving retention rates
Yuri Ryazanov, May. 2020

